


Earlier this week, Basemap presented at the Rural Bus Conference, held at Chester Racecourse, exploring how data can be used to measure the real impact of rural bus service cuts.
Given the location of the conference, we chose to look in more detail at Cheshire West and Chester. It is a useful case study because, while the authority is classified as rural, it also includes the urban area of Chester. This makes it a good example of one of the challenges in bus analysis: headline figures can hide very different experiences between urban centres and surrounding rural communities.
Bus services are often discussed in simple terms: is mileage going up or down? Are there more routes or fewer routes? Has investment helped recovery?
But for passengers, the real question is more practical:

A bus route may still exist on paper, but if the number of trips has fallen, evening services have been reduced, or frequency has dropped, the usefulness of that route changes dramatically.
That is why Basemap has been looking beyond headline bus mileage figures. Using open timetable data, route line information, census data and TRACC accessibility analysis, we wanted to understand whether recent bus investment has translated into meaningful recovery and whether that recovery has been shared equally between urban and rural communities.
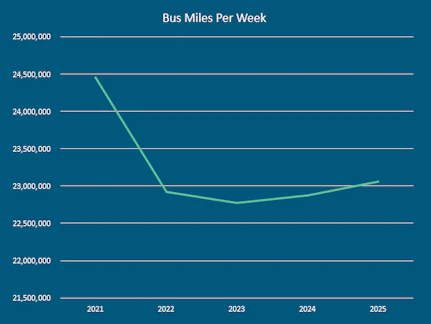
Across England, scheduled bus mileage has started to recover from its post-pandemic low, but it remains below the 2021 high point.
At a national level, scheduled bus miles per week fell from around 24.5 million in 2021 to 22.8 million in 2023, before recovering to just over 23 million in 2025.
That recovery is important, but it does not tell the whole story.
The number of unique services has fallen by around 8%, while operator numbers have reduced from around 840 to 690. This means that although total scheduled mileage may be recovering, the structure of the network has changed. Fewer operators and fewer services can mean less resilience, less choice and fewer alternatives for passengers.
Most importantly, recovery has not been evenly distributed.

One of the clearest findings is the gap between rural population and rural bus provision.
53.1% of England’s population live in rural counties which are predominantly rural, but receive only 42.8% of scheduled bus mileage.
When mileage is compared against population, the difference becomes even clearer. Rural areas receive 168 scheduled bus miles per 1,000 residents, compared with 194 in urban areas excluding London. That is a gap of 26 bus miles per 1,000 residents. When London is included, the gap becomes even wider, with rural areas receiving 86 fewer bus miles per 1,000 residents than urban areas including London.
The issue is not simply whether national bus mileage is rising. It is where that mileage is available, who it serves, and whether it provides a usable level of access.

Cheshire West and Chester has received £5.7 million in Local Bus Grant funding, with plans including the expansion of the iTravel demand responsive transport service, frequency improvements and route protection.
However, when looking at the timetable data between 2021 and 2025, the area still shows signs of significant service reduction:
This makes Cheshire West and Chester a useful example of why local analysis matters. Funding and policy interventions may be in place, but the lived experience of bus availability can still vary significantly between an urban centre like Chester and the surrounding rural communities.
In this case, the analysis suggests that the area has managed to maintain relatively good overall access, but with reduced frequencies and fewer trips. In other words, many people may still be within reach of a bus service, but the service is less useful than it was in 2021.

The maps from the analysis show why it is important to look at more than one measure of accessibility.
At a 24-hour level, overall access may appear largely unchanged. In some cases, access to key destinations such as schools is actually better in 2025 than it was in 2021. This is an important reminder that bus network change is not always a simple story of everything getting worse.
However, when we look at frequency-based measures, a different pattern appears.
The PTAL analysis shows lower scores in 2025, highlighting the reduction in service frequency. This matters because PTAL does not just ask whether a stop exists nearby; it reflects how useful the service is, based on how often buses are available.
The 400m and 800m access maps show a similar pattern. Access to a bus stop may still be available in many areas, but access to a useful level of service has reduced. This becomes particularly clear when looking at stops with four or more services per hour, where the maps show a noticeable decrease.
The trip data reinforces this. Across the week, trips have reduced by around 20%, showing that the reduction is not limited to one day or one time period.

The household access analysis helps show what this means for residents.
Across Cheshire West and Chester, the percentage of households within 400m of a stop with at least one service per hour fell from 55% in 2021 to 48% in 2025. For households without access to a car, this fell from 51% to 45%.
The decline is much sharper when looking at higher-frequency services. The percentage of households within 400m of a stop with four or more services per hour fell from 24% to 9%. For households without access to a car, it fell from 24% to 11%.
At 800m, the same pattern appears. Access to at least one service per hour fell from 77% to 72% for all households, and from 68% to 63% for no-car households. But access to four or more services per hour fell from 44% to 21% for all households, and from 40% to 23% for no-car households.
This is a key point. A basic level of access may remain in many places, but access to a frequent and genuinely useful bus service has declined much more significantly.
For households without a car, this matters even more. These are the households most likely to depend on public transport, so a reduction in frequency can mean fewer realistic options for getting to school, work, healthcare and other essential services.


The analysis becomes even more stark when Chester is removed from the calculation.
Including Chester, 48% of households were within 400m of a stop with at least one service per hour in 2025. Excluding Chester, this falls to 37%.
The gap is even greater for higher-frequency services. Including Chester, 9% of households were within 400m of a stop with four or more services per hour in 2025. Excluding Chester, this falls to just 2%.
At 800m, the difference is particularly striking for households without a car. Including Chester, 63% of no-car households were within 800m of a stop with at least one service per hour. Excluding Chester, this falls to 29%.
This shows how the urban area of Chester helps support the overall county-wide figures. When Chester is removed, the rural access picture is much weaker.
It also reinforces why local analysis matters. Looking only at the whole authority can hide the difference between an urban centre and the surrounding rural communities.

Mileage and frequency are only part of the story. For a bus service to be useful, people also need to be able to reach the stop safely.
In Cheshire West and Chester, only around 25% of roads have pavement access across the county. Many of those pavements are concentrated in and around Chester, while many rural stops lack safe walking routes, waiting areas or the basic infrastructure that makes bus travel feel practical and accessible.
A stop may technically exist, but if people have to walk along roads without pavements, wait on narrow verges or stand in places that feel unsafe, then the service is far less usable.
We will revisit this issue in a future blog, because pavement access and rural stop quality deserve more detailed analysis. But even at this stage, the data helps show the disparity between urban and rural areas.

A clear example is Service 5 between Wrexham and Chester.
The route itself has not disappeared. On a map, it still exists. But the level of service has changed substantially.
Weekly trips fell from 1,021 in 2021 to 430 in 2025. Weekly kilometres fell from 14,641 km to 5,208 km.
For people living along the rural corridor between Wrexham and Chester, this is not a minor timetable adjustment. It means fewer choices, longer waits and reduced flexibility. The route remains, but its usefulness has been dramatically reduced.
This is exactly the type of change that can be missed if we only ask whether a route still exists.

Cheshire West and Chester demonstrates one version of the problem: relatively good overall access, but reduced frequencies and fewer trips.
However, this pattern is not the same everywhere.
Across our wider analysis, we saw many examples where both routes and frequencies had been cut. In those areas, the impact is more severe. People do not just have to wait longer for a bus; they may lose access altogether.
This can affect access to schools, jobs, healthcare and other essential services. It also shows why average figures can be misleading. A national or regional mileage total might suggest stability, while specific communities experience a very different reality.
Some areas are seeing reduced frequency. Others are seeing routes disappear. Some are seeing both.
That is why local, evidence-led analysis is so important.

Basemap created the Bus Mileage tool to help make this type of analysis easier to understand and easier to use.
The tool allows users to explore scheduled bus mileage and service change at a local level, helping authorities, operators and policymakers see where recovery is happening and where gaps remain.
But the wider message is that mileage alone is not enough.
By combining open timetable data, route lines, stop locations, pavement data, census reporting and TRACC accessibility analysis, transport teams can understand:
For passengers, recovery is not measured by a national headline. It is measured by whether the bus still gets them to work, school, healthcare, shops and social activities when they need it — and whether they can safely access the stop in the first place.

The analysis we presented at the Rural Bus Conference shows that bus mileage recovery is real, but uneven.
At a national level, scheduled mileage has started to recover, but rural areas are still receiving less mileage relative to their population. In some places, the route network may still appear intact, but the level of service has weakened through fewer trips, lower frequencies and reduced choice for passengers.
Cheshire West and Chester shows this clearly. While 24-hour accessibility may appear largely unchanged, the more detailed measures show the impact of reduced service levels. PTAL scores are lower, access to higher-frequency services has reduced, and household access analysis shows a clear decline between 2021 and 2025, particularly for stops with four or more services per hour.
The picture becomes even sharper when Chester is removed from the analysis. The urban area helps support the county-wide figures, but outside Chester access is consistently lower, especially for households without a car and for higher-frequency services.
Our wider analysis also showed that this is not the only pattern. In some areas, both routes and frequencies have been cut, causing a more direct reduction in access and, in some cases, making it harder for people to reach schools, jobs, healthcare and other essential services.
The analysis also shows that bus access is shaped by more than timetables. With only around 25% of roads in Cheshire West and Chester having pavement access, many rural stops lack the safe walking routes, waiting areas and surrounding infrastructure needed to make bus travel practical.
Together, the data shows why local, evidence-led analysis matters. Headline mileage figures can suggest recovery, but they do not always show where frequency has fallen, where routes have disappeared, where no-car households are most affected, or where rural stops remain difficult to reach safely.
By combining open timetable data, route lines, pavement data, census reporting and tools like TRACC, transport teams can build a clearer picture of what has changed and where investment can have the greatest impact.