
TRACC and Edubase to Map School Accessibility - A Dudley Case Study
Understanding how accessible schools are to students and staff is vital for education planners, local authorities, and transport analysts. By combining the powerful capabilities of TRACC with the detailed school information from Edubase, users can generate high-resolution insights into the availability of schools in an area.
Today we’ll be looking at how we combined the two to analyse secondary school access in Dudley, West Midlands.
What Is The Edubase Data?
Edubase contains information about all schools in England such as their name and location, capacity and current number of students and any admission policies such as for grammar schools. More information on the data can be found here.
When combined with TRACC's powerful travel time mapping and journey analysis, this can help identify not only if a student can get to a school, but also whether the school has enough capacity for extra students. Keep reading to discover what we found!
Travel Time
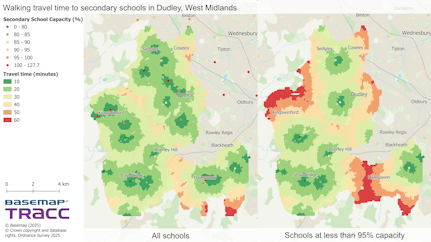
We analysed travel times to secondary schools throughout Dudley using a 100m point grid representing the area. This provided an overall view of travel times with the ability to combine this with demographic data from the 2021 census and understand the number of students within a 60 minute walk of each secondary school. Walking times were based on data from Ordnance Survey’s Multi-Modal Routing Network (MRN) which provides high resolution data on walking and cycling routes as well as highways. Using this analysis we can see that the majority of Dudley are within a 20 minute walk of a secondary school and only 7.5% of residents required to walk over 30 minutes.
Destination Catchment
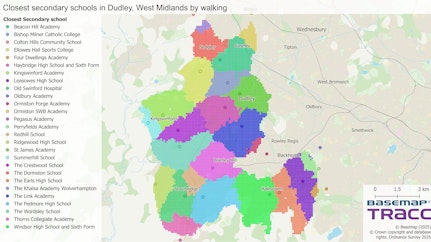
We also identified which origin is closest to each school using the Destination Catchment feature, this highlights the catchment of each individual school. This map can be used to easily see the school with the shortest walk time from any location within Dudley.
Developments and Capacity
Using the Edubase data we can take this a step further - analysing access to schools that are not currently over capacity. When looking at access to schools that are below 95% capacity, it was evident that 69% of residents would have to walk 20 minutes or more. To do this we combined the capacity and number of pupils data from Edubase to filter the results for only schools with at least 5% additional capacity. This analysis allows planners to identify where more capacity is required.
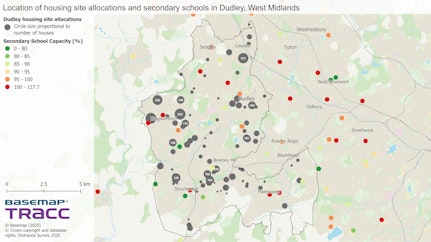
With Dudley Council having a set target of 1,462 new homes per year, any remaining school capacity can be expected to be put under pressure. The latest draft Black Country Plan includes housing allocations for 5856 houses between 2024 and 2039, with 2575 of these being between 2024 and 2029. This is significantly less than what is required to hit the latest government targets.
To fully understand the impact of the current housing allocations on school capacity, we focused on travel times between each housing development and the surrounding secondary schools. This helped to determine the closest school to each development site and using an assumption of the number of 10-16 year olds being approximately 18% of the number of households (based on census data for Dudley), we were able to estimate the number of additional pupils in each school and the impact on their capacity. From this analysis we can see that schools which are already at or over capacity are the closest option for 346 students and the predicted additional students will cause an additional 4 schools to exceed its capacity.
Hansen Score
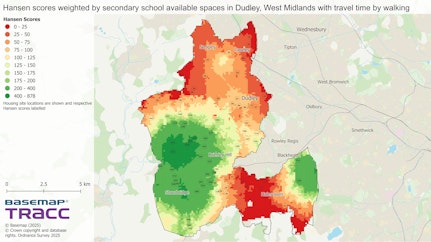
To further analyse the accessibility of secondary schools to the proposed housing developments, we carried out a Hansen Score Analysis. With this you can look at access to a particular destination with an applied weighting, in this case the scores were weighted based on the available school capacity of each school (with schools which are at or over-capacity having a weighting of 0). Using this we can analyse the accessibility of each development to the local schools based on both travel time and available capacity, with the highest scores for developments near schools with high additional capacity.
This analysis supports local authorities to anticipate school pressure before it happens and make plans to alleviate these pressures, whether through positioning housing allocations away from overcapacity schools or through the provision of new schools and extensions to existing schools. This kind of analysis can also be carried out for other key destinations such a hospitals, GPs or nurseries, allowing planning decisions to be backed up with authoritative and detailed data.
Want to see this kind of analysis for your area? Get in touch to learn more about TRACC!