The Impact of Hammersmith Bridge Closure on Journey Times
The Impact of Hammersmith Bridge Closure on Journey Times
The closure of Hammersmith Bridge has had a profound impact on local travel, altering journey times for thousands of commuters. To understand these changes, we were asked to analyse how travel times have evolved since the bridge’s closure. Using historical data from 2019 and recent information from October 2024, we leveraged TRACC to evaluate journey time variations across postcode sectors. This analysis revealed significant increases in travel times for both cars and buses, highlighting the broader implications of the bridge closure and other traffic management initiatives like low traffic neighbourhoods and 20mph speed limits.
Pre and Post-Closure Journey Time Analysis
Having access to detailed Ordnance Survey data, including historical average speeds and timetables, allowed us to undertake a comprehensive study. The bridge, which closed to car traffic in 2019, forced drivers to take lengthy detours to cross the Thames. Similarly, bus routes were diverted, significantly impacting journey times. We loaded this data into TRACC and analysed journey times between postcode sectors, focusing on areas most affected by the closure:

Car Journeys: A Widespread Increase in Travel Times
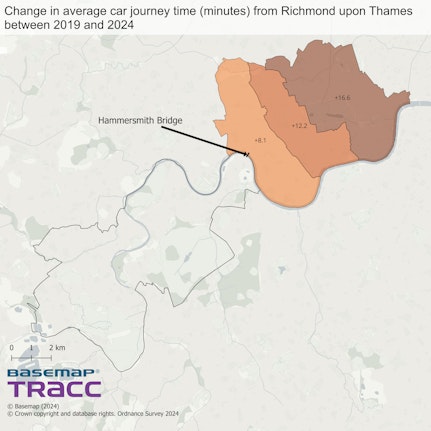
The closure of Hammersmith Bridge has had a profound impact on car journeys, particularly for those traveling between SW13 9 and W6 9, two postcode sectors heavily reliant on this crossing. Prior to the closure, drivers could complete this journey in a relatively short time. However, with the bridge no longer accessible to vehicles, travel times have surged by over 20 minutes, with routes now covering an additional 5 miles. This detour not only adds to the time spent on the road but also increases fuel consumption, emissions and travel costs. Our analysis of 92,994 potential journeys showed that more than 80,000 of them have worsened, underscoring the scale of disruption for local drivers.
While the bridge closure is the most immediate cause of these delays, other factors have compounded the issue. The introduction of low traffic neighbourhoods (LTNs) in surrounding areas has redirected traffic away from residential streets, funneling it onto already congested main roads. Additionally, the implementation of 20mph speed limits in many parts of London has contributed to slower overall traffic speeds. Together, these factors paint a complex picture of how interlinked infrastructure changes can amplify the impact of a single disruption like the Hammersmith Bridge closure.

Bus Journeys: A Closer Look at the Worsening Delays
The closure of Hammersmith Bridge has severely impacted bus journey times, exacerbating travel challenges for thousands of passengers who rely on these routes daily. Our analysis revealed striking increases in journey durations, particularly between postcode sectors SW13 8 and W6 9.
Before the closure, this route offered a relatively swift and reliable connection, with travel times averaging 9 minutes during peak hours. However, post-closure, these journeys have been significantly disrupted. Passengers now face an average travel time of over 40 minutes, more than a four-fold increase. In some cases, journey times have stretched beyond 50 minutes, depending on the time of day.
Broader Implications
These findings underscore the cascading effects of the Hammersmith Bridge closure, not only on direct journeys but also on the wider transportation network. Increased travel times have led to heightened congestion, longer commutes, and broader challenges for public transport users and drivers alike.
Conclusion
The ability to conduct this detailed analysis was made possible by the use of TRACC and access to comprehensive datasets, including historical average speeds and timetables. TRACC’s powerful capabilities allowed us to efficiently model and compare pre- and post-closure journey times across thousands of routes. This enabled us to uncover critical insights into how travel patterns have shifted and identify areas most affected by the disruption. By leveraging these tools, we were able to provide a clear and data-driven understanding of the challenges faced by both drivers and public transit users, ensuring that future decisions are informed by robust evidence.