
Bus Stop Accessibility in London
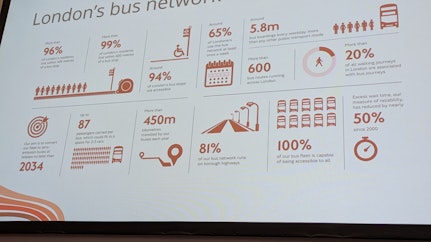
Our Chief Product Officer Dan Saunders recently attended the UITP Summit in Hamburg where one of the talks led by TfL shared their insights on London's bus network. Some of the stats provided showed what appeared to be great accessibility levels across the City. Notably so the 99% of residents who live within 600m of a bus stop. But is access as good as it seems in reality?
What are your thoughts? What do you consider important to measure walk access to your local transport network?
To start the conversation we did a deep-dive into pedestrian access to London's bus stops using TRACC. Read on to see what we found!

Local Accessibility
Using TRACC’s Local Accessibility tool, we found that 96.8% of residents live within 400m of a bus stop as the crow flies - a well known unrealistic depiction of travel between points. This significantly drops to 83.2% when calculated using the actual road network. The 600m figure also drops from 99.5% to 96% if the road network is considered.
When filtering to only bus stops served by 4+ buses per hour, accessibility declines further — especially during off-peak times:
- Weekday morning (7–9am): 400m coverage falls to 79.2%, and 600m to 93.6%
- Sunday evening (7–9pm): only 73.5% within 400m, and 90.1% within 600m
This highlights how headline accessibility stats can mask significant variation depending on service frequency and walking access.
Network-based analysis matters — especially when planning for equitable access by foot or bike.
Public Transport Accessibility Level (PTAL)
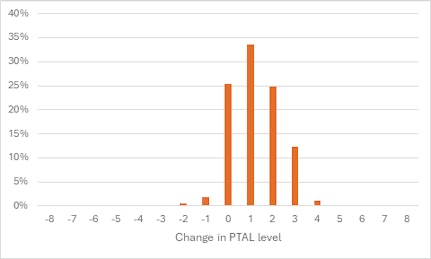
We also compared TfL’s latest Public Transport Accessibility Levels (PTAL) with those generated in TRACC. TfL’s 2023 PTAL update was based on the Ordnance Survey Integrated Transport Network (last updated in 2019), along with BusNet and Railplan data. However, the transport network has changed significantly in the past two years — including the introduction of new Superloop services — prompting us to recalculate PTAL scores using the more up-to-date OS Highways network and the latest public transport data.
Our analysis revealed that 72% of London now scores higher on PTAL than indicated by TfL’s 2023 figures, while just 25% of areas have retained their original scores. This demonstrates how using current data can significantly affect accessibility assessments — a crucial consideration for informed planning.

Interested in exploring your own area’s accessibility in more detail? Get in touch to see how TRACC can help.