
For many people, public transport is a critical lifeline, providing them with access to jobs, education and services. While there is agreement that connectivity is important, how can this be measured? SESTran Regional Bus Strategy sets out a connectivity metric that can be used to explore how well Scotland’s settlements are connected by measuring how many other settlements are reachable by public transport.
Utilising TRACC, this analysis looked at accessibility for three criteria based on the SESTran guidance. This meant that based on the population of a settlement different minimum direct public transport connections were necessary, with larger settlements needing higher service frequency standards. Access was analysed against:
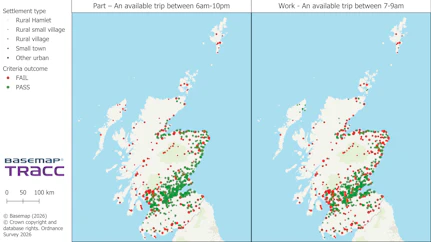
Part – An available trip between 6am-10pm
Working – An available trip between 7am-9am
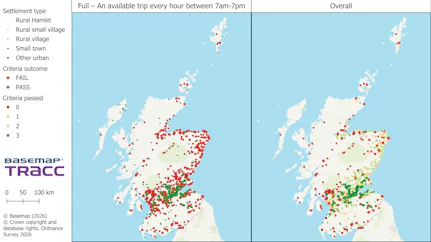
Full – An available trip every hour between 7am-7pm
These journeys were required to be a maximum of 60 minutes with a maximum 800m walk from/to public transport stops. In general, each settlement had to access the next largest settlement type (see 'About this analysis' for more details).
The results highlight a clear pattern: while some areas benefit from strong, interconnected networks, others fall short, not always due to poor provision, but often because of geography itself.
Overall only 29% of the 636 settlements met all three of the criteria. Rural hamlets recorded the highest pass rate at 54%, though this is helped by this settlement type only having to meet the Part criteria. 36% of rural small villages passed, although these were not required to pass the Full criteria. Around 26% of rural villages, small towns and urban settlements passed all three criteria. This lower pass rate highlights the higher requirements in urban areas.

Some areas exceed the criteria, such as Bush, a rural hamlet which can reach three rural villages, three small towns and three urban areas, far surpassing the requirement to access one small town. Meanwhile some urban areas such as Dunoon failed to meet the criteria, with access to only two rural villages. This highlights the importance of taking into account the location of areas and distance to other settlements. Another example of this is Perth which fails due to only having access to one other urban area but is connected to 29 other settlements within 60 minutes.
As may be expected, the best connected settlements (based on how many other settlements it is connected to) is largely made up of urban settlements, though with key surprises such as Edinburgh coming 9th support the observation that the distance to other settlements can make a large difference. This is further highlighted by Stirling coming in first place, with its central location between Glasgow and Edinburgh as well as many towns and villages.
The impact of distance to other settlements is emphasised when the results of this analysis are mapped. This shows a band of passing settlements near Glasgow and Edinburgh, as well as along the east coastline of Scotland where there is a higher number of settlements.
It is important to note the limitations of this analysis:
As highlighted, local knowledge and an understanding of geographic constraints are essential when assessing connectivity. These factors should be considered alongside the analysis to inform meaningful improvements to the public transport network.
Connectivity varies significantly across Scotland, with only 29% of settlements meeting all three criteria, showing clear differences in access depending on location and settlement type. Geography plays a major role, as some areas fail not due to poor public transport provision but because of their distance from other settlements and the wider network structure. Higher service expectations are also harder to meet, particularly in urban areas where stricter criteria apply. Importantly, connectivity is more nuanced than a simple pass/fail measure, with some settlements falling short of the criteria while still maintaining strong links to multiple destinations. Overall, data-led analysis should support, not replace, local knowledge, ensuring that results are interpreted in the context of real-world constraints and opportunities.

This analysis looked at the number of settlements accessible within 60 minutes by public transport at different times of the day. It was inspired by the levels of service outlined in the SEStran Regional Bus Strategy. This sets out criteria for public transport access between settlements, with each settlement size aiming to be connected to the next largest settlement type. For the analysis, a maximum travel time of 60 minutes was enforced to ensure that journey lengths were reasonable as well as a maximum walk to/from public transport stops of 800m. The settlement locations were based on data from the National Records of Scotland (for Rural village, Small Town and Urban) and OS built up areas (Rural Small Village and Rural Hamlet). Ordnance Survey’s Highways network was used for the road alongside public transport timetables for January 2026 from DataCutter.