

The need for housing in the UK is growing, with many councils being asked to double or even triple their housing targets. However, with sustainability also being a pressing concern, it is important that these new developments are located correctly.
One element of ensuring sustainable development is to provide residents with viable alternatives to private car. Whether that’s rail, bus, or high-quality active travel links. Such alternatives can help prevent people using a private car for all their journeys as well as improving the quality of life for residents without access to a car.
A Government press release from November 2025 states that housebuilding around train stations will be given a default "yes" in future in order to help meet housebuilding targets. See here for more information on these targets. The Rail Industry Association (RIA) have also recommended Station Investment Zones within 800m of rail stations, with investment for housing and employment in these areas as well as community spaces and improved transport connections.
When looking at walking distances, considering the road network can make a large difference to what 800m actually looks like. Using crow-flies distances risks overstating how many people and sites are genuinely within walking distance of rail, potentially skewing planning decisions, brownfield prioritisation and housing capacity estimates. In this post we will look at the areas within 800m of rail stations by crow-flies and by using the road network and see how these differ, by area, population and by how many brownfield sites are located within this area.

Crow-flies buffers can be seen everywhere from development masterplans to walking maps in town centres as they are simple to create and understand. But this visualisation rarely tells the true story. Crow-flies analysis oversimplifies walking routes by assuming a straight line journey, without barriers such as buildings, rivers or roads. This means that they can overestimate the accessible area around a location and differ greatly from the actual experience.
Our analysis shows that for 51% of stations, less than half of the crow-flies catchment area is actually reachable on foot via the road network. An extreme case is Smallbrook Junction in the Isle of Wight, where there is no public access due to it existing purely as a connection between two rail systems, despite this crow-flies results show access in all directions.
We then focused on the area, number of residents and brownfield sites within 800m of every active rail station in England. This analysis used Ordnance Survey’s Highways (RRami and Paths) dataset for the road network and a 50m grid as origins. This provided more detailed analysis, ensuring changes in access over small distances were covered and smaller links such as Public Rights of Way were taken into account. The number of residents was based on data from nomis, extracted using Datacutter and the location and size of brownfield sites was collected from the UK Government Brownfield Land Dataset. Station access points from Ordnance Survey were used as destinations and the results combined where a station contained multiple access points.

The area within 800m of a station was found to decrease by 53% on average when the road network was included, with the number of residents decreasing by a similar 54%. The number of brownfield sites also decreased, though by only 23% with the size of these brownfield sites decreasing by 26%.
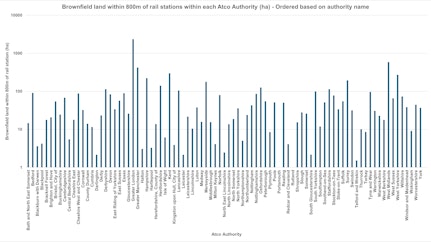
This analysis found that around 11,300 brownfield sites were located within 800m walk (using road network) of a rail station, with an average size of 0.7ha. Assuming a density of 40 houses per hectare (Land Use Change Statistics), this could result in an average of 28 houses per site and 295,400 houses if all brownfield sites within 800m of rail station were used for housing.
The largest changes in the number of brownfield sites accessible when road network was taken into account, could be seen in urban areas such as Birmingham and Manchester, where there are many small brownfield sites (0.47ha). It is worth noting that for large brownfield sites where the centroid was used as the “destination”, the brownfield site may be accessible with the addition of new road or active travel links which would connect it to the train station.
This shows the importance of including the road network when analysed journeys and the impact that this can have. Future recommendations for access within a certain distance or time should therefore explicitly state that this should use the road network rather than assuming crow-flies. This will ensure that sites identified within 800m are genuinely accessible and do not require additional infrastructure such as bridges or new roads to connect them to the rail station.
TRACC allows you to analyse accessibility by public transport, walking, cycling or car, taking into account the road network, unwalkable links such as motorways and the frequency of public transport services. This will support obtaining realistic catchments to housing developments, train stations and key destinations. With the Datacutter integration, TRACC also make it easy to gather the latest data from authoritative sources such as Ordnance Survey.
Ensuring that your analysis reflects real world situations is critical for making informed choices regarding investments and when comparing different options.