
TRACC Used To Create Accessibility Indices In St Louis (USA)
| Client | East West Gateway Council of Governments |
| Date | 06.07.2026 |

TRACC Used To Create Accessibility Indices In St Louis (USA)
East-West Gateway Council of Governments (EWG) serves as the Metropolitan Planning Organization (MPO) for St. Louis region which serves almost 3 million residents. Traditionally, an accessibility map would look at travel times between large Traffic Analysis Zones (TAZs). EWG wanted to enhance this type of analysis to see how many key destinations are accessible by public transit and walking, within a specified time. This type of analysis allowed multiple destinations to be looked at in one go and to add a weighting to each destination type to provide a different view of accessibility. To do this, since 2019 they have used TRACC software provided by Basemap. This is the only product on the market which could easily load in the required data at the large scale of analysis required and then provide accurate and trusted travel times to their destination data.
Calculating the Score
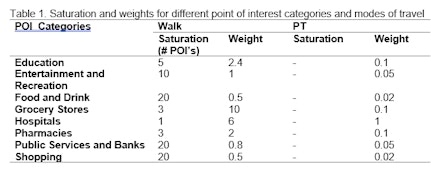
The score is created using four main inputs which are customizable in TRACC. For this project, it was decided to look at Census block centroids to define the origins. The destinations were split into 8 different types of Points of Interest (POI) (See Table 1). The next element was travel mode – Public transit (PT) and walking were utilized, although cycling is a consideration for future analysis.
After a calculation has been completed an accessibility function is utilized, which measures the ease in which an individual can travel from the origins to destination. A catchment is used from each origin to destination based on travel mode and maximum journey time (Walk 40 minutes and PT 60 Minutes) and this is used to create an index for each census block. This data is easily created within TRACC, as every origin to destination is given a travel time, creating hundreds of millions of possible journeys which are extracted as an O/D matrix file.
The O/D matrix files created in TRACC were used to find out how many POIs are within the catchment. Each POI within the catchment area contributes to the accessibility score of the origin. The accessibility value is between 0 and 1 and is calculated with an exponential decay function. This means that if the point of interest is in the exact vicinity of the origin then the value will be 1. As the point gets farther from the origin based on travel time, its value approaches 0.
Analyzing accessibility in small geographies such as census blocks reveals hotspots with very poor accessibility that will not show up when bigger geographies are used. TRACC helped us estimate travel times and accessibility between tens of thousands of census blocks within a reasonable time-frame, a task no other software I was familiar with was able to handle.

Amir Poorfakhraei
Senior Transport Planner, East-West Gateway

Saturation
Using a different method by defining the maximum number of points of itnerest within a category counting toward sustainability

Calculating varied weighting values for Public Transport.
Table 1 shows the saturation for different POI’s when walking. There is no saturation for PT (no limit to the maximum accessibility score) as all POI’s within catchment are important.

Highlighting Low Acccess Areas
TRACC has allowed EWG to very quickly get a view of accessibility in their region highlighting both low accessible areas. This view is “Eye-Opening” according to Amir and it is great they now have a tool in TRACC that can assist with the monitoring